Interactive Circos Plot
interacCircos can display multi-track and interactive Circos plot in a coding-friendly manner.
No Perl or JavaScript experience is required !
Same structure and logic as ggplot2.
Designed for visualization of interactive Circos plot
Inspired by circosJS, BioCircos.js and NGCircos and developed based on htmlwidgets framework.
interacCircos can display multi-track and interactive Circos plot in a coding-friendly manner.
No Perl or JavaScript experience is required !
Same structure and logic as ggplot2.
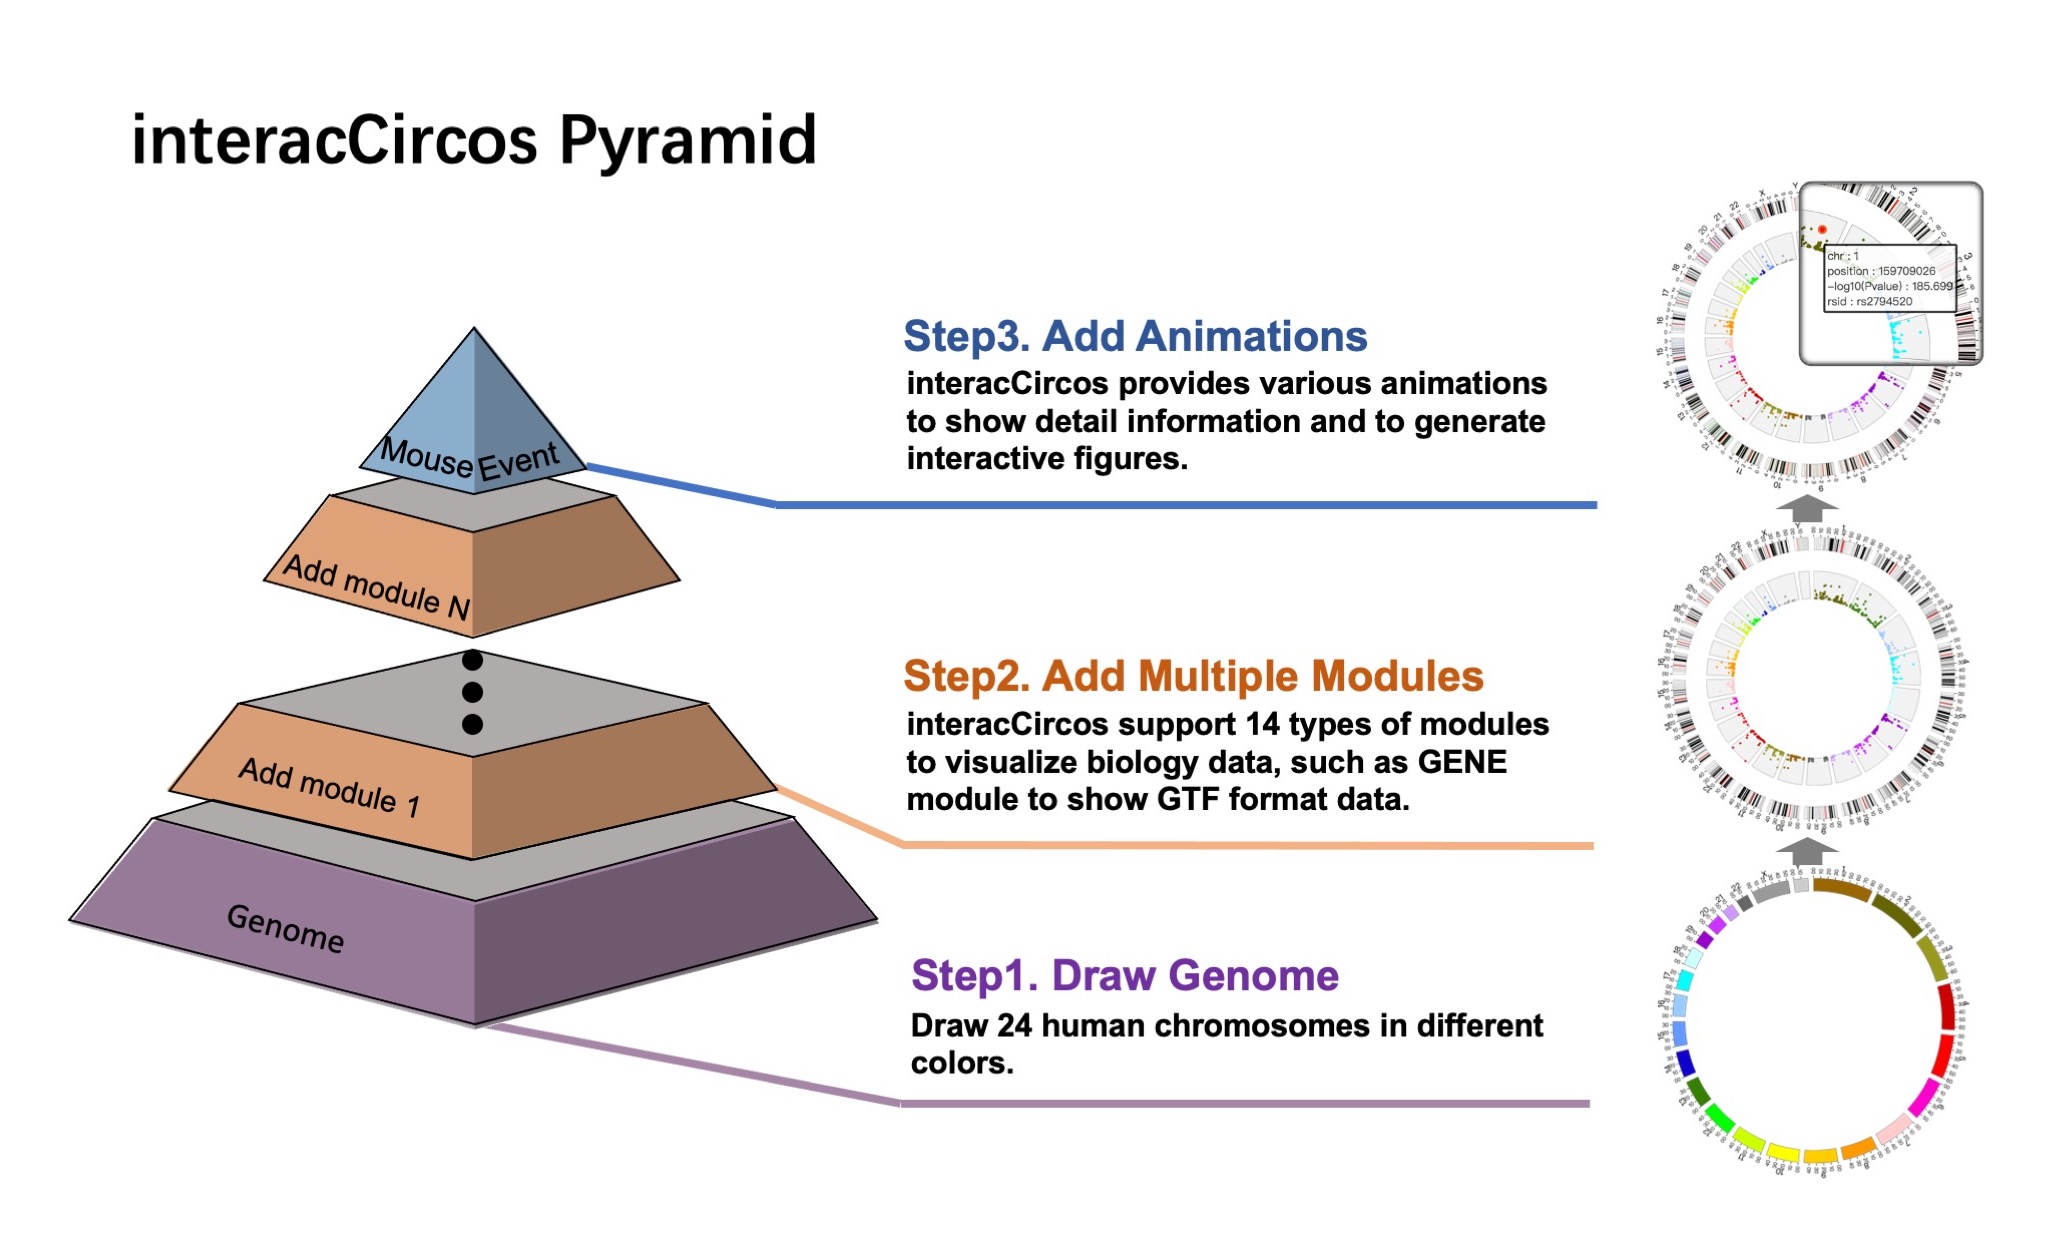
interacCircos support multiple common types of plot including bubble, chord, heatmap, histogram, line, lollipop, point...
interacCircos also design several plots for popular biological data format including wig, cnv, snp, gene...
interacCircos apply opening animation for every plot function. Animation of every plot is highly customizable.
interacCircos also support customizing mouse event and mouse tooltips for plot function.
interacCircos use data frame as input, which is compatible with output from other packages
Chord plot for displaying the relationship between gene, exon, protein, etc.
Heatmap plot for displaying the gene expression, probe signal, etc.
Histogram plot for displaying the gene expression, probe signal, etc.
Link plot for displaying the gene fusions, interaction, SV data, etc.
Lollipop plot for displaying the somatic mutation, germline variation, etc.
Line plot for displaying the gene expression, r2 value, etc.
SNP plot for displaying the SNP density data, GWAS data, etc.
Wig plot for displaying the gene expression data, read depth etc.
Gene plot for displaying the gene profile, transcript profile, RNA profile, etc.
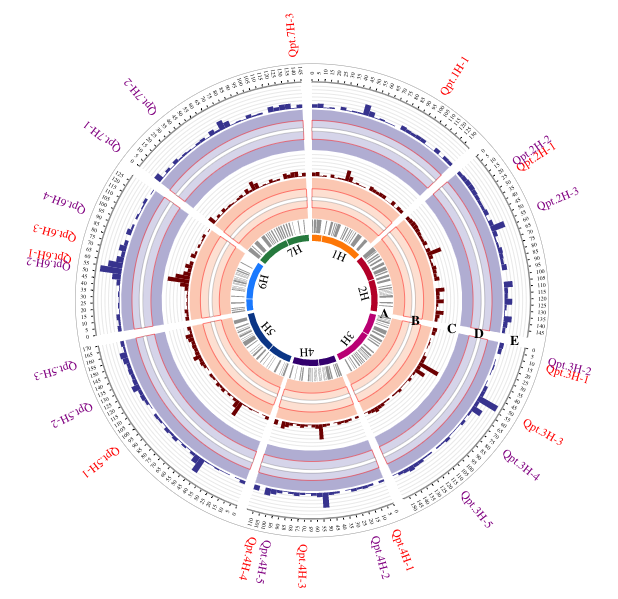
An interactive Circos plot indicating QTL involved in net blotch resistance and displayed using histogram, arc, link, background, text function.
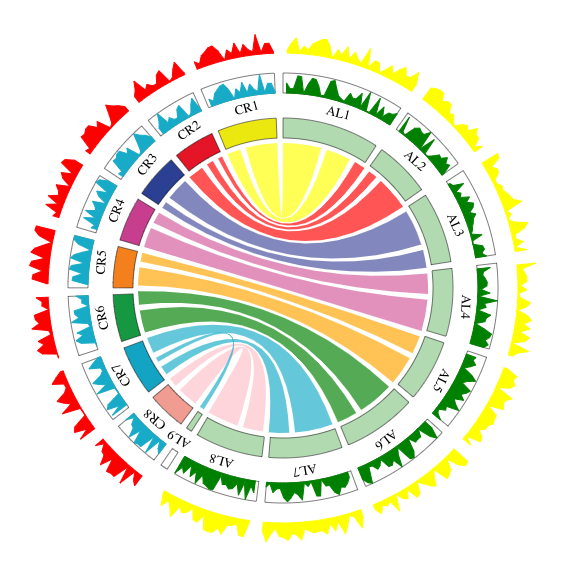
An interactive Circos plot displaying the comparative genomic mapping in C. rubella(CR), A. lyrata(AL) and displayed using chord, wig, background function.
I'm a PhD student at Harbin Institute of Technology working on genome visualization and single cell ATAC sequencing.
If you have any questions about interacCircos, you are very welcome to contact me through github or email.
If you are interested in our lab, you are very welcome to visit our website!