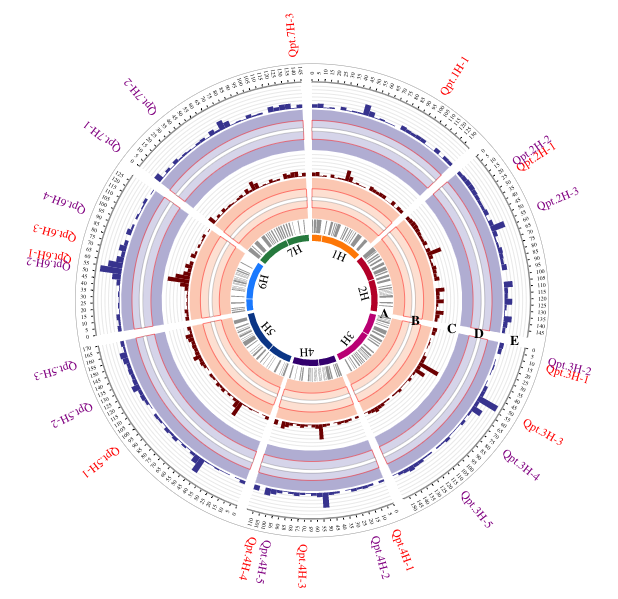
An interactive Circos plot indicating QTL involved in net blotch resistance and displayed using histogram, arc, link, background, text function.
An interactive Circos plot indicating QTL involved in net blotch resistance and displayed using histogram, arc, link, background, text function.
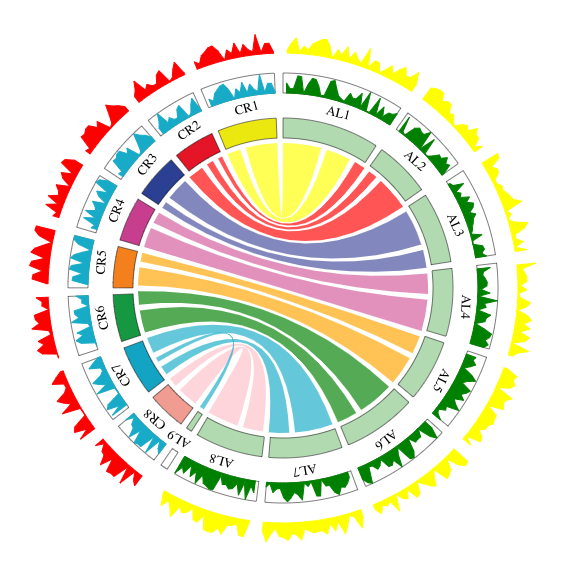
An interactive Circos plot displaying the comparative genomic mapping in C. rubella(CR), A. lyrata(AL) and displayed using chord, wig, background function.
I'm a PhD student at Harbin Institute of Technology working on genome visualization and single cell ATAC sequencing.
If you have any questions about interacCircos, you are very welcome to contact me through github or email.
If you are interested in our lab, you are very welcome to visit our website!