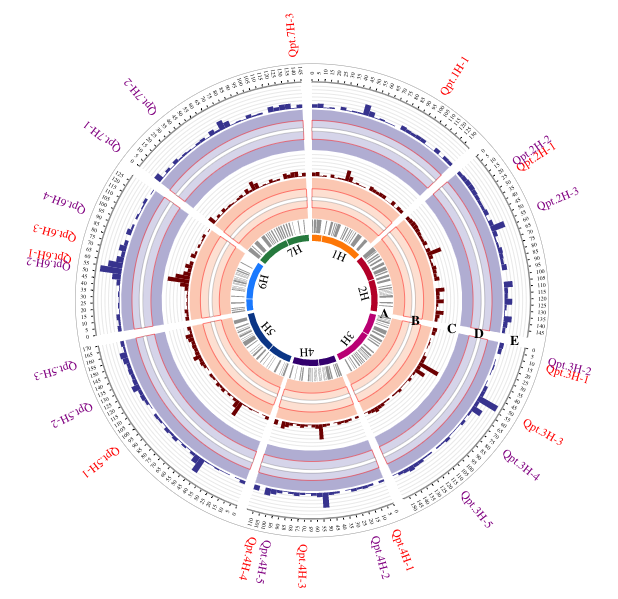
An interactive Circos plot indicating QTL involved in net blotch resistance and displayed using histogram, arc, link, background, text function.
interacCircos is available at Github /Bioconductor or you can download here
# Install devtools first!
if (!require('devtools')){install.packages('devtools')}

devtools::install_github('mrcuizhe/interacCircos')

# R package of htmlwidgets, RColorBrewer, plyr, jsonlite
# and grDevices are required !
#Download interacCircos package to local disk first!

install.packages("PATH/TO/PACKAGE/interacCircos_X.X.X.tar.gz", repos = NULL,
type = "source")

# R package of htmlwidgets, RColorBrewer, plyr, jsonlite
# and grDevices are required !
#Install Bioconductor first!

if (!requireNamespace("BiocManager", quietly = TRUE))
    {install.packages("BiocManager")}

BiocManager::install("interacCircos")

# R package of htmlwidgets, RColorBrewer, plyr, jsonlite
# and grDevices are required !
# Bioconductor version: ≥ Release (3.13)
# R version ≥ 4.1
If you are a NG-Circos/BioCircos.js/circosJS user and familiar with the modules and their data structure, it will only take you a few moment for getting used to interacCircos.
a main function called Circos() is necessary to display the genome for Circos plot, which is the coordinates basis for all modules.
Up to 21 types of modules can be added to genome track through a parameter in Circos() called moduleList. Modules can be added by simply using "+" in moduleList. For example, moduleList=CircosText()+CircosBackground() means apply one TEXT module and one BACKGROUND module together to genome track. The other parameters in Circos() are all correspond to that in NG-Circos/BioCircos.js/circosJS one to one.
Note that for 3 of all modules(COMBINATION, COMPARE, REDIRECT from NG-Circos) , their parameters are included in Circos()
For the other 18 of 21 modules, which has an independent function(CircosArc(), CircosAuxLine(), CircosBackground(), CircosBubble(), CircosChord(), CircosChord.p(), CircosCnv(), CircosGene(), CircosHeatmap(), CircosHistogram(), CircosLegend(), CircosLine(), CircosLink(), CircosLollipop(), CircosScatter(), CircosSnp(), CircosText(), CircosWig() from NG-Circos/BioCircos.js/circosJS), all data(if needed) are input through a parameter called data in a data.frame structure and all parameters are correspond to that in JacaScript version.
library(interacCircos)
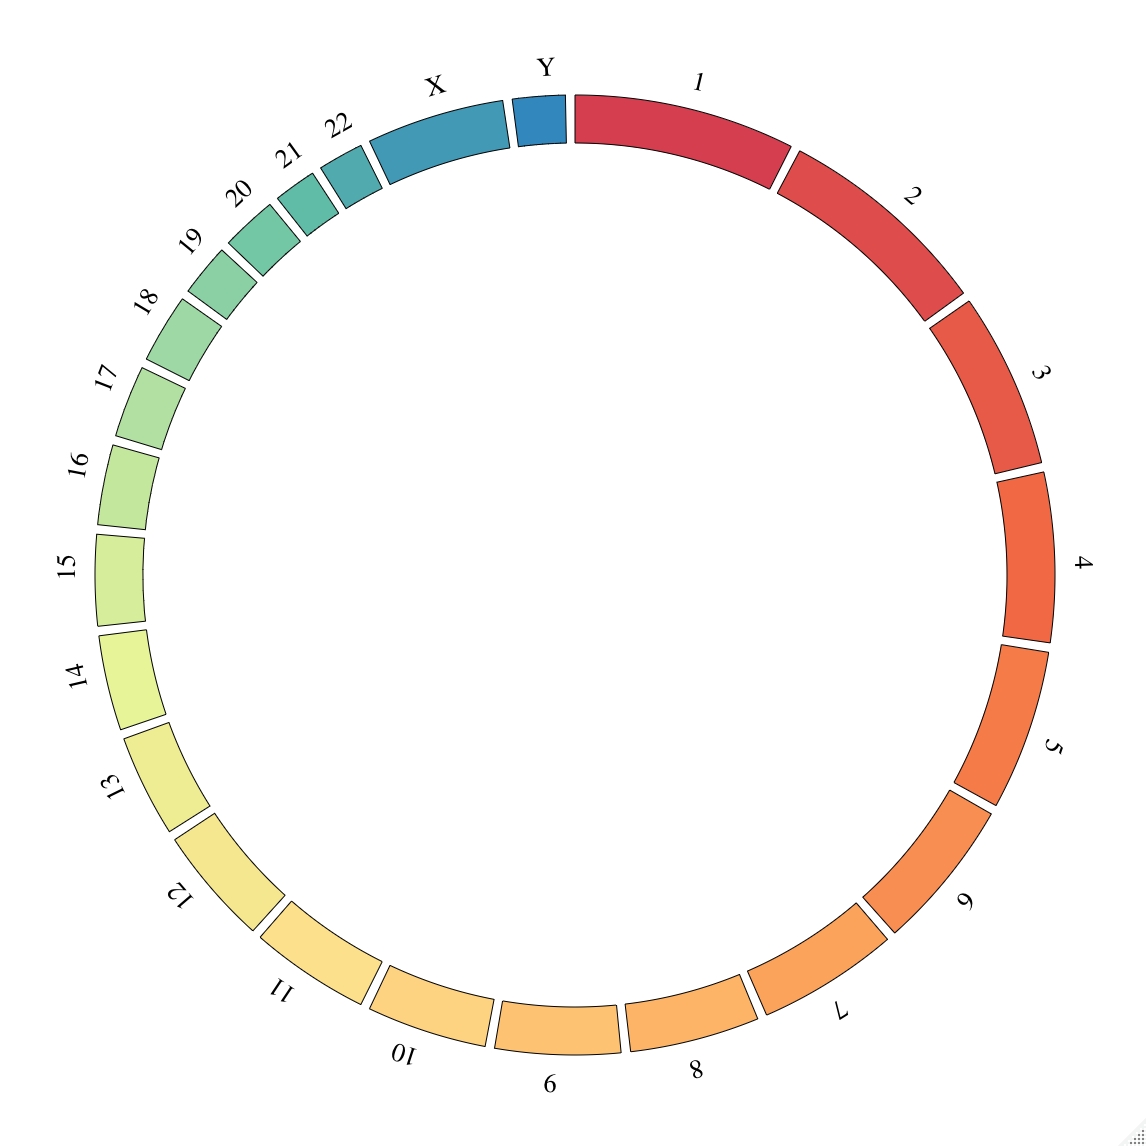
Circos(zoom=FALSE)
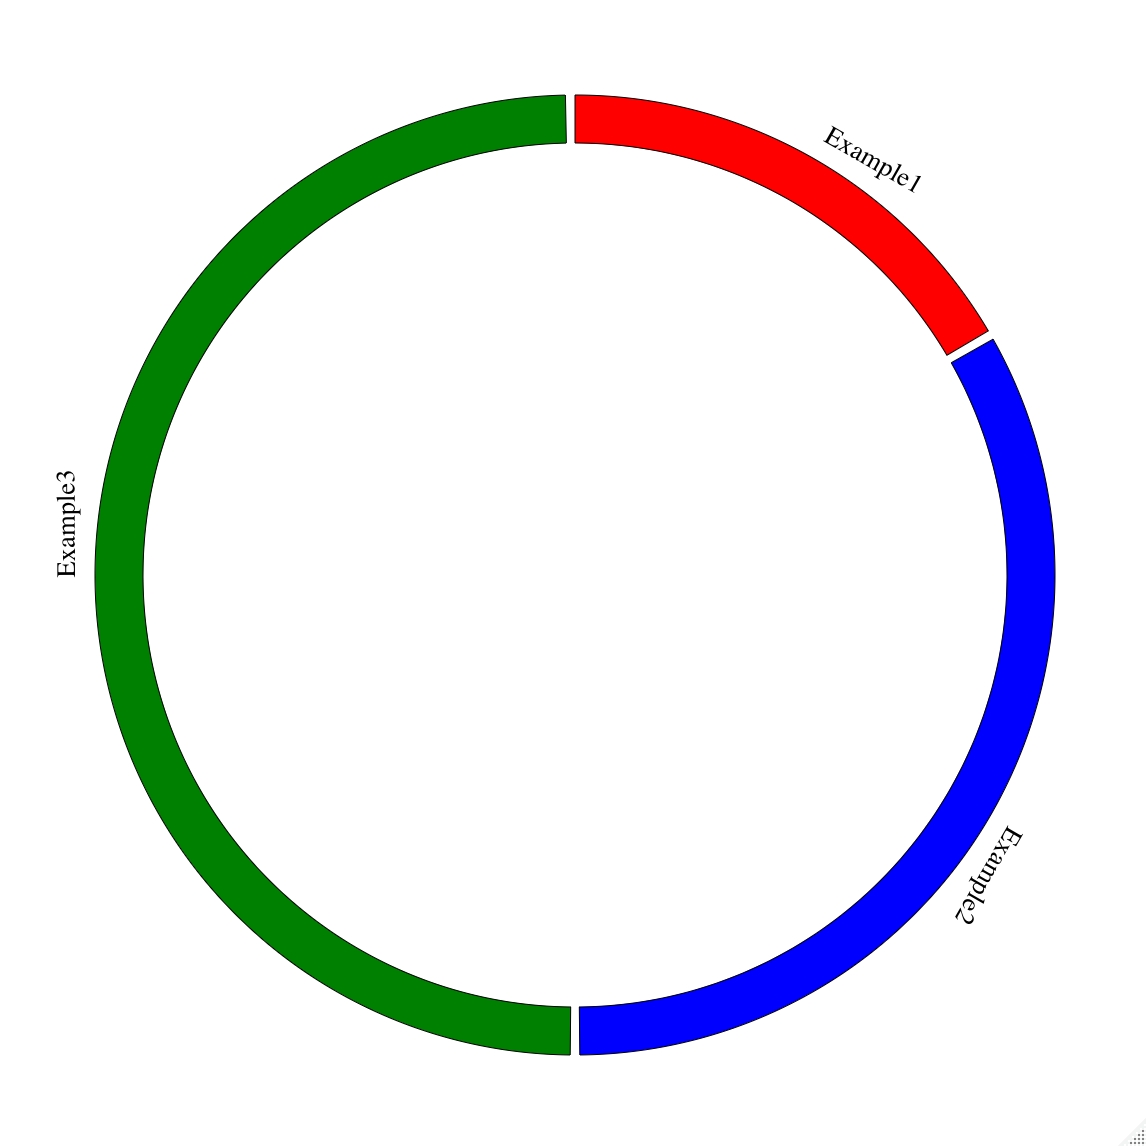
The genome is set by default as hg19, the genome can be changed by setting genome=list("Example1"=100,"Example2"=200,"Example3"=300). Meanwhile, the color of each chromosome can be changed by setting genomeFillColor = c("red","blue","green")
library(interacCircos)

Circos(zoom = FALSE,genome=list("Example1"=100,"Example2"=200,
"Example3"=300),genomeFillColor = c("red","blue","green"))
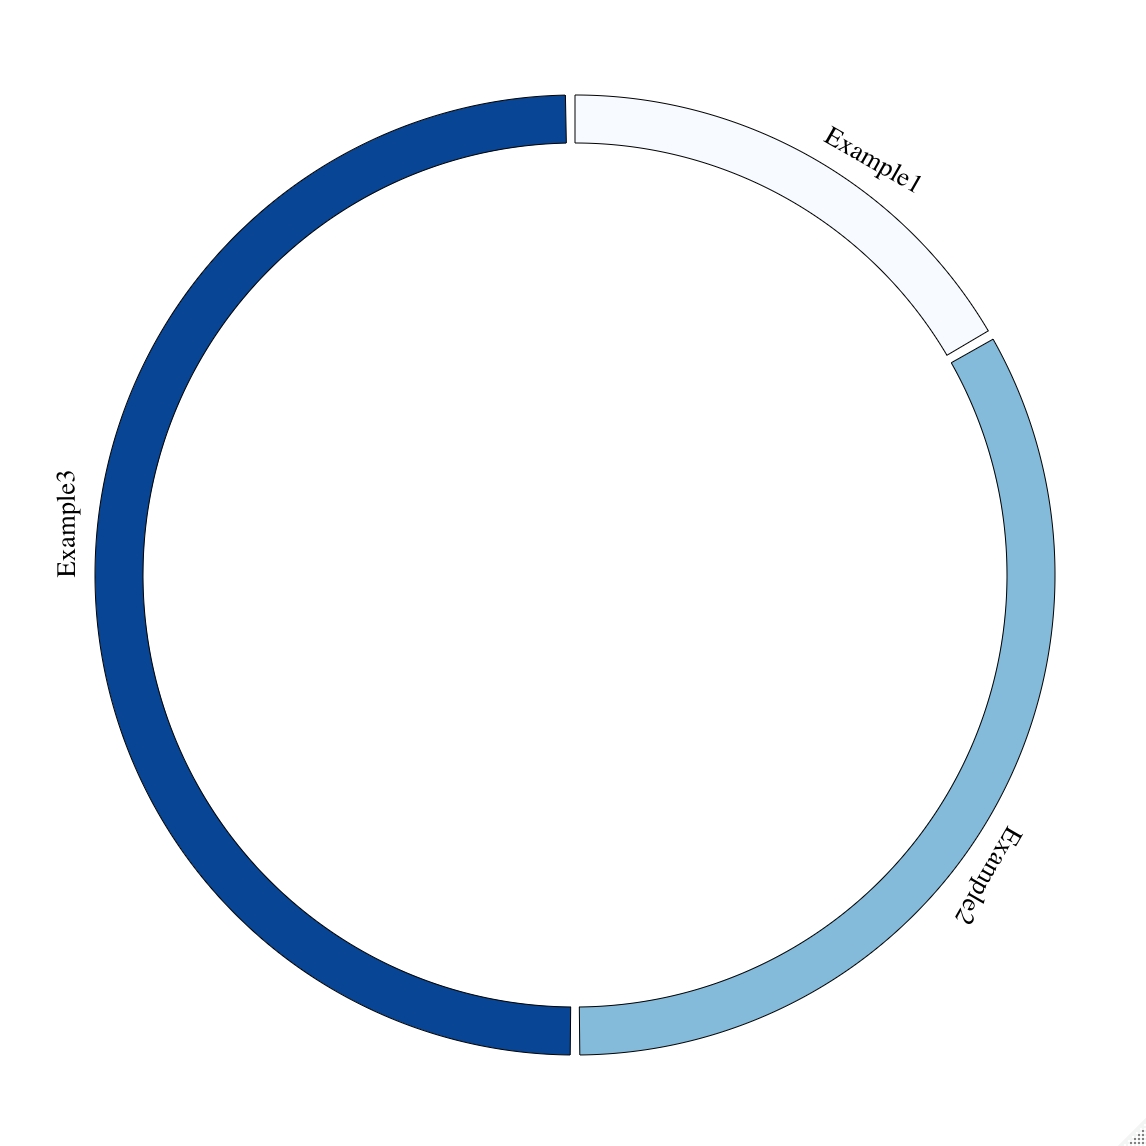
The filling color for chromosome can also be set automatically by choosing a RColorBrewer palette, such as Blues
library(interacCircos)

Circos(zoom = FALSE,genome=list("Example1"=100,"Example2"=200,
"Example3"=300),genomeFillColor = "Blues")
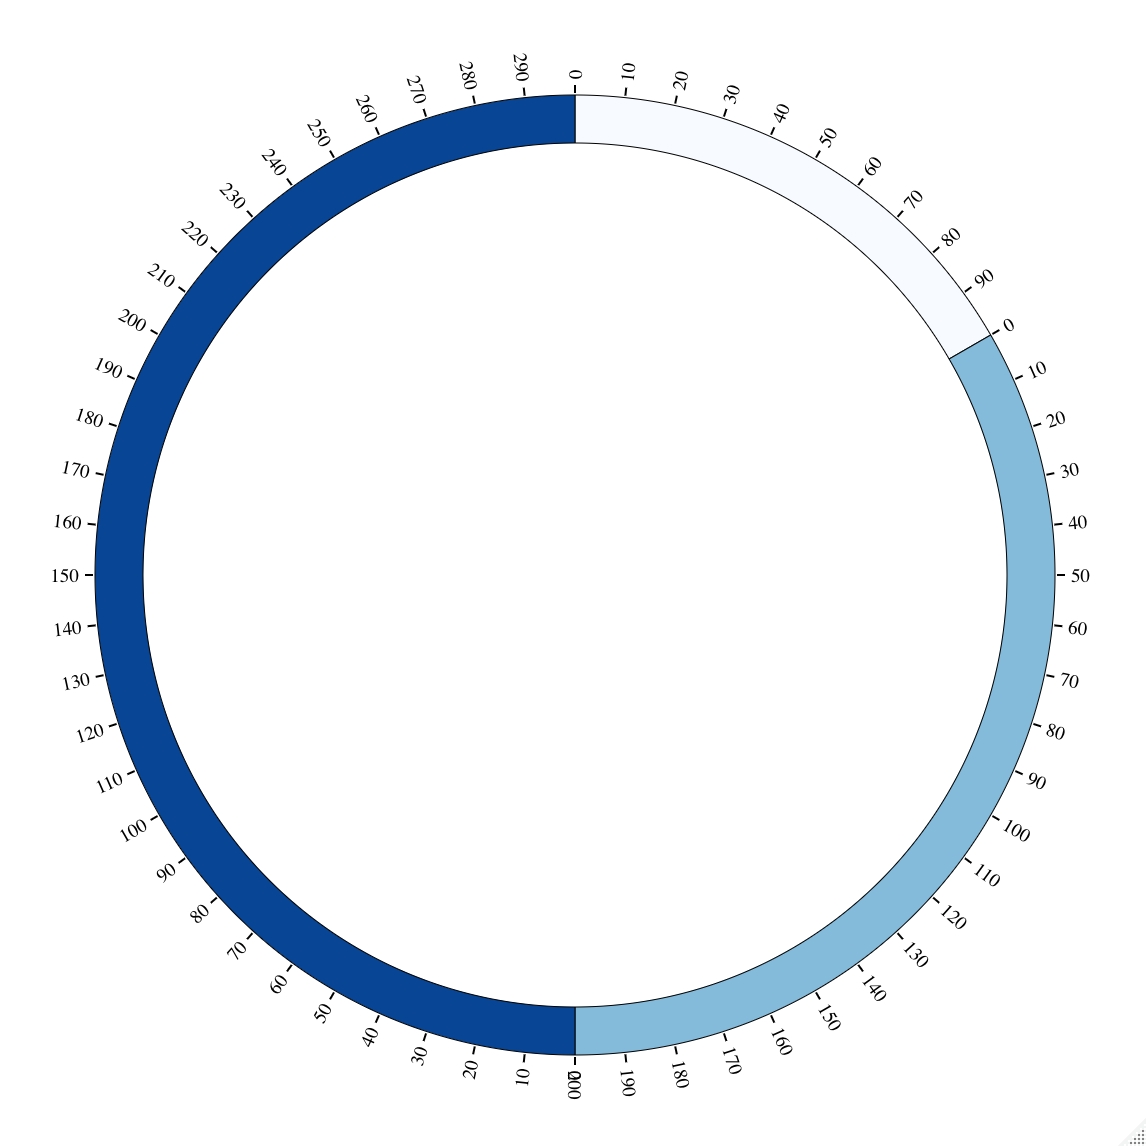
Other parameters are all documented and try ?Circos() for details
library(interacCircos)

Circos(zoom=FALSE,genome=list("Example1"=100,"Example2"=200,
"Example3"=300),genomeFillColor = "Blues",chrPad = 0,genomeTicksDisplay = TRUE,
genomeTicksScale = 10,genomeLabelDisplay = FALSE)
Each plot function (e.g. Module of NG-Circos) is added through moduleList, a parameter of Circos()
Totally 18 modules:
CircosArc()
CircosAuxLine()
CircosBackground()
CircosBubble()
CircosChord()
CircosChord.p()
CircosCnv()
CircosGene()
CircosHeatmap()
CircosHistogram()
CircosLegend()
CircosLine()
CircosLink()
CircosLollipop()
CircosScatter()
CircosSnp()
CircosText()
CircosWig()
can be added by using "+" in moduleList
If you are using RStudio, the plot can be saved as an image or a html page directly from viewer panel.
If you are using R in command, the plot can be saved as a html page, thanks to the htmlwidgets library
library(interacCircos)
library(htmlwidgets)

plot <- Circos(zoom=FALSE,genome=list("Example1"=100,"Example2"=200,
"Example3"=300),genomeFillColor = "Blues",chrPad = 0,genomeTicksDisplay = TRUE,
genomeTicksScale = 10,genomeLabelDisplay = FALSE)

saveWidget(plot, "plot.html")
The plot will be saved at your current directory
An interactive Circos plot indicating QTL involved in net blotch resistance and displayed using histogram, arc, link, background, text function.
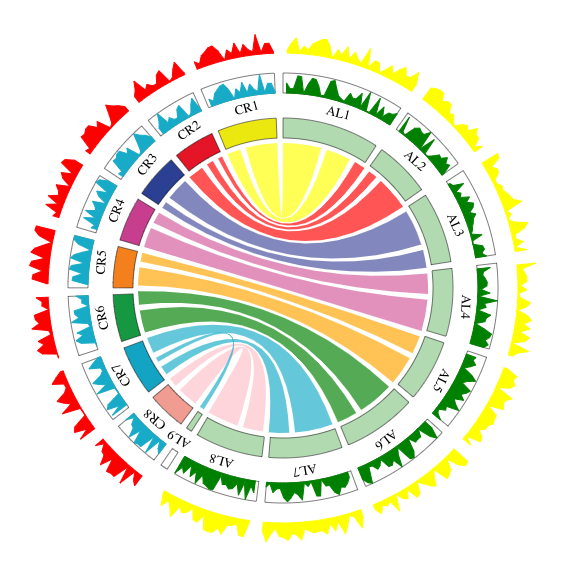
An interactive Circos plot displaying the comparative genomic mapping in C. rubella(CR), A. lyrata(AL) and displayed using chord, wig, background function.
I'm a PhD student at Harbin Institute of Technology working on genome visualization and single cell ATAC sequencing.
If you have any questions about interacCircos, you are very welcome to contact me through github or email.
If you are interested in our lab, you are very welcome to visit our website!